Changing up the pitch mix: What’s worked for the Colorado Rockies

DENVER, COLORADO - AUGUST 01: Starting pitcher Kyle Freeland #21 of the Colorado Rockies throws in the first inning against the San Diego Padres at Coors Field on August 01, 2020 in Denver, Colorado. (Photo by Matthew Stockman/Getty Images)
3 of 4
Next
German Marquez of the Colorado Rockies
German Marquez of the Colorado Rockies /

A quarter of the way through this surreal 2020 season and the Colorado Rockies starters have been a major surprise throughout the league. Not even the most faithful of Rockies fans could have predicted their rotation would be among the league leaders in a plethora of pitching stats, both traditional and advanced.

Coming into Sunday’s game, the Colorado Rockies starting rotation ranked third in both ERA (2.65) and ERA- (55). If you’re unfamiliar with ERA-, it’s a stat that takes Park Factors into account, meaning it looks at the Rockies’ ERA and factors in the effects that Coors Field would have on an ERA. At 55, it means they’ve been 45% better than the MLB average starting rotation, which is phenomenal to say the least.

More impressively, though, is the fact that it consists of four homegrown pitchers that have each been with the team for at least four years now. German Marquez, Jon Gray, Kyle Freeland and Antonio Senzatela have turned around last year’s calamity of chaos and gave the Rockies enough of a head start that making it into this year’s expanded playoffs feels like nothing but a formality at this point.

But what’s been the key? The same four guys from the past four years are just dominating now. Granted we’re only on our fourth round through the rotation, but what we’ve seen so far has been promising … and a change in pitch mix is to thank. So let’s take a look at what’s different from past years and what to expect throughout the rest of the season, whether that’s good or bad.

/

A changeup in usage

The biggest change we’ve seen throughout the rotation is an increased usage in each pitcher’s offspeed pitches, specifically the changeup. Last year, the staff threw fastballs 53.8% of the time. This year, it sits at 47.5%. That 6% drop is almost exactly equivalent to the increase in changeup usage (9.1% in 2019 to 15.7% in 2020). Slider and curveball usage is also on the rise, but the changeup is the most prominent change.

Here’s how each pitcher has increased their usage from 2019 to 2020:

Marquez: 3.2% -> 7.9%
Gray: 2.9% -> 13.5%
Freeland: 11.3% -> 31.0%
Senzatela: 4.3% -> 12.1%

More from Colorado Rockies News

The increase in usage has helped Senzatela the most as batters are whiffing on 21.1% of all his changeups and only have a wOBA of .191 against it. He’s also seen improved results on his slider where he’s only yielding a wOBA of .058 on it whereas last season hitters were putting up a wOBA of .315 against it.

Freeland, on the other hand, is throwing his changeup 31% of the time. That’s nearly equivalent to how often he’s throwing his fastball (32.3%). He’s also apparently gotten rid of his cutter (which he threw 31.2% of the time in 2019) and has split that usage between his slider (18.8%) and new curveball (18.0%). His slider has produced the best results so far, only allowing hitters to tag it for a wOBA of .067 in his first three starts.

While the changeup’s working on a whole for the rotation, one starter who could possibly benefit from throwing less changeups is Jon Gray, who has an wOBA of .692 against his changeup. He’d likely benefit more from using his fastball, which hitters have only hit to a tune of a .144 wOBA in his first three starts (which is significantly improved from last season when hitters put up a .405 wOBA against his fastball).

Antonio Senzatela of the Colorado Rockies
Antonio Senzatela of the Colorado Rockies /

Statistical observations from the change in pitch mix

It’s hard to doubt that the move away from fastballs in favor of more offspeed pitches has been a negative for the starters as a whole. Every pitcher has seen improvement in their park adjusted stats (ERA- and FIP-) and those stats as a whole show that so far it’s working well. So what should we expect the rest of the way?

As a whole, the staff has seen their K% increase from 18.8% to 19.6%. This has been driven mostly by increases from Marquez (24.3% to 30.7%) and Senzatela (13.1% to 19.4%). We’ll likely see Marquez’s K% drop a couple points while Senzatela’s will probably hover around that number as his 2019 rate seems to be an outlier. If you’re thinking about why the staff’s increase in K% isn’t higher given the increases from those two, that’s because Gray’s numbers have dropped from 23.5% to 10.6%. Freeland’s K% of 15.7% isn’t too far from his career norm, but there may be room for improvement. As a staff, this rate shouldn’t drop much.

There’s going to be some regression, though. The staff has been overperforming to a degree and a couple stats that point to this are their BABIP (Batting Average on Balls In Play) and Hard Hit Percentage.

More from Rox Pile

For BABIP, the staff has a combined for a number of .232. That’s the second-best in MLB with only the Twins posting a better number. What it suggests is that the Rockies have had an element of luck on balls in play. A lot of that is a result of defensive superiority from guys like Nolan Arenado, Trevor Story, and David Dahl. That shouldn’t be a shock to anyone. But it’s an improvement from the last three years which saw BABIPs of .313, .297, and .305. The best BABIP in the past few years by starters was .265 by the Braves in 2018, so we should expect negative regression there.

Rockies starters are also getting hit surprisingly hard given the results they’re putting up. Their current Hard Hit Percentage of 45.8% ranks as the third-highest in the Majors behind only the Diamondbacks and Rays. Thankfully for the Rockies, a large amount of batted balls have resulted in ground balls (47.6%, seventh-best in the Majors). And a high Hard Hit Percentage doesn’t always equate to bad performance, but it doesn’t exactly help things either. The three teams with the highest hard hit percentage last year (Angels, Giants, Diamondbacks) ranked 30th, 22nd, and 13th in ERA-, respectively. If the Rockies keep getting groundballs, they’ll be fine.

Another stat to keep an eye on is the Rockies current HR per Fly Ball rate of 9.3%. That number is crazy low. The best number put up in recent years is 10.3% by the Cardinals starters in 2018. For the Rockies, we saw rates of 15.7% in 2017 and 13.9% in 2018, so we know numbers close to that should result in playoff caliber pitching. What we don’t want to see happen is a rate of 20.8%, which we saw in 2019. That’s unlikely to happen again, but what these numbers show us is that the Rockies’ change in pitch mix has resulted in less hard contact on fly balls, which is a very good thing.

We should expect it to increase from where it’s at, but it shouldn’t get to 2019 levels where we want to bash our heads in after yet another three-run home run that puts the Rockies in an 8-0 hole in the 3rd inning.
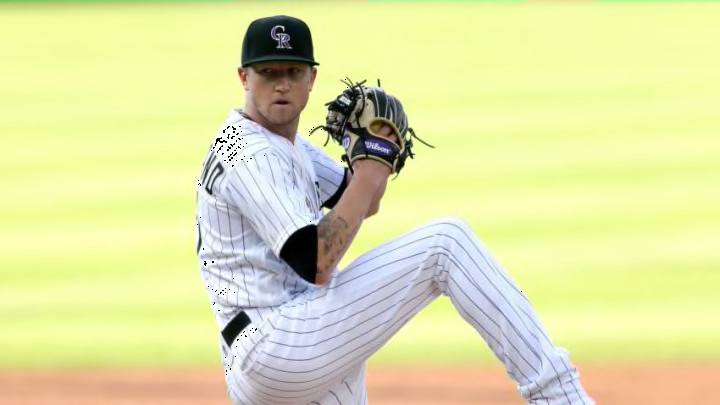
Kyle Freeland of the Colorado Rockies
Kyle Freeland of the Colorado Rockies /

Positives that will stick

It’s not all pessimistic in the future for the Rockies, though. They’ve definitely had an element of luck and that’s evident by looking at their ERA- (55) and FIP- (79). If you’re new to FIP or FIP-, it helps to show if a team or pitcher is getting lucky or unlucky when compared to their ERA or ERA-. With the Rockies, a higher FIP- compared to their ERA- means they’ve been getting a little lucky. But it’s not like if their ERA- was more true to their FIP- that they’d be terrible. The next closest team to the Rockies by FIP- is the Padres at 80, whose starters have posted an ERA of 3.48, which ranks eighth in the Majors. I think we all would appreciate a season-long ERA of 3.48 for the Rockies starters, or something similar, so they’re still doing really, really well.

The Rockies are also only walking 7.1% of batters, good enough for eighth-best in the majors. That’s not too far off the pace of other years as well where they walked 8.6%, 7.8%, and 8.4% of batters. So while there are lots of other stats that may be considered false positives, this is par for the course and we shouldn’t expect any regression here.

We also should expect the Rockies to keep getting a decent number of ground balls. We saw earlier that their Hard Hit Percentage is at a concerning level right now, but if it results in balls getting drilled into the ground, then that’s not going to hurt as bad as balls that are getting driven into the empty second level stands in right field. Their current Ground Ball Percentage of 47.6% is pretty much in line with percentages from past years of 47.8%, 44.9%, and 49.2%. So if they keep getting these results, then we’ll keep seeing positive results from this pitching staff.

The pitching staff has been a bright spot so far this season and has provided major relief for the lineup. Even with some expected regression, we should still expect good things from this staff. Pitching was the story in recent playoff seasons and it’s no surprise that with the Rockies aiming for a playoff spot again that pitching is the story once more.

Next. 3 things we learned from the series win over Seattle. dark

Note: All statistics were before Sunday’s loss in Seattle.

Next