How the Colorado Rockies would actually perform in a season at a neutral site

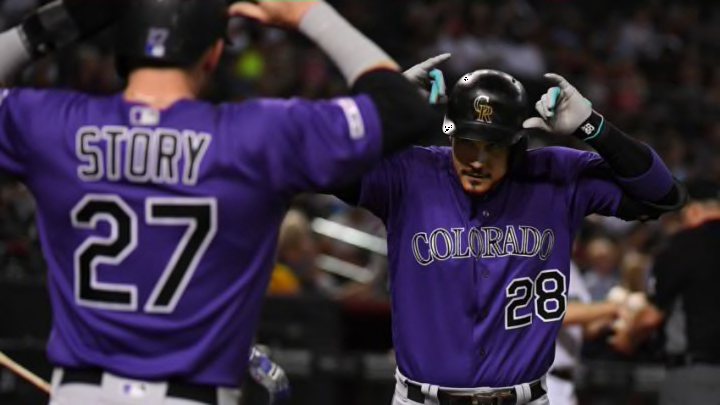
PHOENIX, ARIZONA - AUGUST 20: Nolan Arenado #28 of the Colorado Rockies celebrates with Trevor Story #27 after Arenado's two-run home run off of Alex Young of the Arizona Diamondbacks during the fourth inning at Chase Field on August 20, 2019 in Phoenix, Arizona. Arenado was playing in his 1,000th MLB game. (Photo by Norm Hall/Getty Images)
1 of 7
Next
CLEVELAND, OHIO – JULY 09: Charlie Blackmon #19 of the Colorado Rockies and the National League hits a solo home run during the sixth inning against the American League during the 2019 MLB All-Star Game, presented by Mastercard at Progressive Field on July 09, 2019 in Cleveland, Ohio. (Photo by Kirk Irwin/Getty Images)
CLEVELAND, OHIO – JULY 09: Charlie Blackmon #19 of the Colorado Rockies and the National League hits a solo home run during the sixth inning against the American League during the 2019 MLB All-Star Game, presented by Mastercard at Progressive Field on July 09, 2019 in Cleveland, Ohio. (Photo by Kirk Irwin/Getty Images) /

When Colorado Rockies baseball in 2020, they may have to play some games at a neutral playing site.

One of the potential scenarios for the MLB season starting back up involves all teams playing at neutral sites. As you can imagine, people have already jumped the gun with how this would be a hindrance to the Colorado Rockies given how poorly they perform on the road. They still view things with the Rockies through the scope of Home/Road splits and as I’ve already told you, that’s not how it should be done.

Instead, there are other ways for us to predict how the Rockies would perform if an entire season were to be played at a neutral site. One of those ways is to look at how they perform when they open the season on the road, giving us more of a true look at how things may go when there’s no Coors Effect to combat.

Only Spring Training games precede these games, so we can get a more accurate look at how they hit without battling the effects of altitude. And lucky for us, the Rockies like opening up away from Coors to set up that awesome Friday Opening Day holiday for us in Denver, giving us more games to pull from.

So let’s take a look at the last 10 seasons and see how the Rockies performed prior to playing at Coors. From there, we’ll see how that’d compare to teams in recent history to get a feel for how a season at a neutral site would actually go for the Rockies. We’ll even give you some comparisons for the current Rockies to show you who they’d compare to from other teams. So let’s dig in.
PHOENIX, ARIZONA – AUGUST 21: Raimel Tapia #15 of the Colorado Rockies singles in the first inning of the MLB game against the Arizona Diamondbacks at Chase Field on August 21, 2019 in Phoenix, Arizona. (Photo by Jennifer Stewart/Getty Images)
PHOENIX, ARIZONA – AUGUST 21: Raimel Tapia #15 of the Colorado Rockies singles in the first inning of the MLB game against the Arizona Diamondbacks at Chase Field on August 21, 2019 in Phoenix, Arizona. (Photo by Jennifer Stewart/Getty Images) /

In the past 10 years, there’s one thing I’ve learned about the Rockies: They love starting the season against the Brewers. Is it a contractual obligation that we didn’t know about? I assume so.

Of the nine seasons that have opened up on the road (2011 started at home), four of them started at Miller Park. Lucky for me and this article, Miller Park has a fairly neutral Park Factor (101 per Fangraphs). Below are the opponents the Rockies played in each respective season and how many games it was prior to their home opener at Coors:

  • 2010: Milwaukee Brewers, 3 games
  • 2011: Started the season at home vs the D’Backs
  • 2012: Houston Astros, 3 games
  • 2013: Milwaukee Brewers, 3 games
  • 2014: Miami Marlins, 4 games
  • 2015: Milwaukee Brewers, 3 games
  • 2016: Arizona D’Backs, 3 games
  • 2017: Milwaukee Brewers, 4 games
  • 2018: Arizona D’Backs and San Diego Padres, 7 games
  • 2019: Miami Marlins and Tampa Bay Rays, 7 games

In total, we have data from 37 games (the Brewers represent about a third of those games). That’s not the largest sample size, but if we go back further we run the risk of pulling data from a different era, therefore hindering the relevance of the results. However, this gets us a little over 1,400 plate appearances.

DENVER, CO – AUGUST 14: Nolan Arenado #28 of the Colorado Rockies smiles as he runs the bases after hitting a ninth inning walk off two-run homer against the Arizona Diamondbacks at Coors Field on August 14, 2019 in Denver, Colorado. (Photo by Dustin Bradford/Getty Images)
DENVER, CO – AUGUST 14: Nolan Arenado #28 of the Colorado Rockies smiles as he runs the bases after hitting a ninth inning walk off two-run homer against the Arizona Diamondbacks at Coors Field on August 14, 2019 in Denver, Colorado. (Photo by Dustin Bradford/Getty Images) /

In those 1,400 plate appearances, get a decent mix of games at more neutral parks (Miller Park and Chase Field) along with some more extreme pitcher’s parks (Petco Park, Marlins Stadium, Tropicana Field, Minute Maid Ballpark). And the Rockies’ wRC+ varies too from multiple series where they just crushed it (149 and 138 vs the Brewers in 2013 and 2015 plus 137 vs the D’Backs in 2016). Unfortunately, we have a major drop-off from that horrendous start in 2019 (23 vs the Marlins and Rays). So, the results should be fairly balanced when everything’s lumped together.

Here’s how the Rockies slash line looks in these games:

  • BA: .256
  • OBP: .311
  • SLG%: .421

That gives us a team OPS of .732 while the Rockies’ 2019 OPS was .782 (slash line of .265/.326/.456). By traditional stats, that seems like a decent drop, but this is also why park-adjusted stats are so important. That OPS of .782 gave the Rockies a wRC+ of 86 last season while the Cubs, who posted an OPS only 1 point higher at .783, had a wRC+ of 102.

So what does that OPS of .732 really mean?

LOS ANGELES, CALIFORNIA – JUNE 23: David Dahl #26 of the Colorado Rockies celebrates his solo homerun with Ryan McMahon #24, to take a 1-0 lead over the Los Angeles Dodgers, during the first inning at Dodger Stadium on June 23, 2019 in Los Angeles, California. (Photo by Harry How/Getty Images)
LOS ANGELES, CALIFORNIA – JUNE 23: David Dahl #26 of the Colorado Rockies celebrates his solo homerun with Ryan McMahon #24, to take a 1-0 lead over the Los Angeles Dodgers, during the first inning at Dodger Stadium on June 23, 2019 in Los Angeles, California. (Photo by Harry How/Getty Images) /

What we’re going to do with our newfound Rockies’ neutral OPS of .732 is find some comparisons to help us determine what a likely wRC+ would be.

With a slash line of .256/.311/.421, the most direct comparison from recent years is the 2014 Baltimore Orioles who posted a slash line of .256/.311/.422. That team’s wRC+ was 104, meaning they were about four percent better than league average offensively, and the Orioles went 96-66 on their way to an ALCS appearance against the Kansas City Royals. Park Factors change over time, though, so while that that 104 wRC+ could certainly be a possibility, it probably isn’t all that likely for the Rockies in the year 2020 (you can thank the juiced balls from recent years for making this less likely).

Instead, let’s find a team with a very neutral park factor that’s more recent with a very similar OPS. Lucky for us, an extremely comparable team is right there: the Toronto Blue Jays.

In 2019, the Blue Jays posted an OPS of .733 which led to a wRC+ of 92. According to Park Factors listed on FanGraphs, the Park Factor of the Rogers Centre is 100. That means it’s the exact definition of neutral (anything above 100 is a hitter’s park, anything below 100 is a pitcher’s park).  As well, the AL East has a decent mixture of hitter’s parks (Fenway at 105 and Camden Yards at 102), neutral parks (Yankee Stadium and Rogers Centre both at 100), and a more extreme pitcher’s park (Tropicana Field at 96). Their OPS isn’t going to be skewed too greatly one way or another, therefore their wRC+ should be fairly reliable for us.

For reference, the Park Factor for Coors Field is 115, easily the highest in the majors.

A wRC+ of 92 would be an increase of the Rockies’ offensive productivity by about six percent. For a team that hasn’t posted up a wRC+ above 88 over the last three seasons (88, 88, and 86 from 2017-2019), that would be a welcome increase.

SAN FRANCISCO, CALIFORNIA – SEPTEMBER 24: Charlie Blackmon #19 of the Colorado Rockies celebrates a three run home run with Raimel Tapia #15 and Nolan Arenado #28 during the sixteenth inning against the San Francisco Giants at Oracle Park on September 24, 2019 in San Francisco, California. (Photo by Daniel Shirey/Getty Images)
SAN FRANCISCO, CALIFORNIA – SEPTEMBER 24: Charlie Blackmon #19 of the Colorado Rockies celebrates a three run home run with Raimel Tapia #15 and Nolan Arenado #28 during the sixteenth inning against the San Francisco Giants at Oracle Park on September 24, 2019 in San Francisco, California. (Photo by Daniel Shirey/Getty Images) /

It wouldn’t make a dramatic difference from how they performed in 2019, but it would be an improvement. Those six points brings them up from ranking 26th in the league to tied for 19th with the Blue Jays and Pirates. So we’re essentially getting bumped up from “bad” to “well, that’s not that bad.”

It does show a dramatic difference, though, from how many of the “experts” may perceive the Rockies would perform at a neutral site based off how they traditionally perform on the road.

In 2019, the Rockies had a road wRC+ of 74, good enough for next to last in the majors above only the Marlins (this means they hit 26 percent worse than league average on the road). This is the perception that many have of how the Rockies would truly hit if they never played at Coors.

It’s extremely short-sighted and ignores many of the factors that the Rockies encounter that no other teams face (specifically the adjustments brought on by consistently going back and forth between games at altitude and games at sea level).

The mentality is also rooted in simply looking at traditional stats because yes, you’re going to see a decrease in nearly every stat. So how would this six-point wRC+ increase look for some of our best players’ traditional stat lines? Let’s figure it out.

DENVER, CO – AUGUST 16: Nolan Arenado #28 of the Colorado Rockies hits an eighth inning solo homer against the Miami Marlins at Coors Field on August 16, 2019 in Denver, Colorado. (Photo by Dustin Bradford/Getty Images)
DENVER, CO – AUGUST 16: Nolan Arenado #28 of the Colorado Rockies hits an eighth inning solo homer against the Miami Marlins at Coors Field on August 16, 2019 in Denver, Colorado. (Photo by Dustin Bradford/Getty Images) /

Here’s how we’re going to figure out how some of the Rockies’ superstars new stat lines would look at a neutral site:

We’ll take that six-point wRC+ increase, apply it to our selected Rockies player’s 2019 wRC+, and find a like player from recent years whose wRC+ matches that (or is close) and has a similar approach at the plate (using things like K% and BB%).

Nolan Arenado 

2019 Stats:

  • .315/.379/.583 Slash Line
  • .962 OPS
  • 41 HR
  • 128 wRC+
  • 9.4 percent BB rate
  • 14.0 percent K rate

Applying the six-point increase to wRC+ gives Nolan a new wRC+ of 134. Based on that, his best comparison is 2016 Ryan Braun, whose stat line reads as follows:

  • .305/.365/.538 Slash Line
  • .903 OPS
  • 30 HR
  • 134 wRC+
  • 8.2 percent BB rate
  • 17.4 percent K rate

Charlie Blackmon

2019 Stats:

  • .314/.364/.576 Slash Line
  • .940 OPS
  • 32 HR
  • 125 wRC+
  • 6.3 percent BB rate
  • 16.4 percent K rate

This would give Blackmon a new wRC+ of 131 after the six-point boost. This makes his best comparison 2019 Justin Turner:

  • .290/.372/.509 Slash Line
  • .881 OPS
  • 27 HR
  • 132 wRC+
  • 9.3 percent BB rate
  • 16.0 percent K rate

Trevor Story

2019 Stats:

  • .294/.363/.554 Slash Line
  • .917 OPS
  • 35 HR
  • 121 wRC+
  • 8.8 percent BB rate
  • 26.5 percent K rate

Story’s new wRC+ would be 127 at a neutral site. This makes his best comparison 2017 Domingo Santana:

  • .278/.371/.505 Slash Line
  • .875 OPS
  • 30 HR
  • 127 wRC+
  • 12.0 percent BB rate
  • 29.3 percent K rate
PHOENIX, AZ – MARCH 29: Nolan Arenado #28 of the Colorado Rockies high fives manager Bud Black #10 after hitting a solo home run against the Arizona Diamondbacks during the sixth inning of the opening day MLB game at Chase Field on March 29, 2018 in Phoenix, Arizona. (Photo by Christian Petersen/Getty Images)
PHOENIX, AZ – MARCH 29: Nolan Arenado #28 of the Colorado Rockies high fives manager Bud Black #10 after hitting a solo home run against the Arizona Diamondbacks during the sixth inning of the opening day MLB game at Chase Field on March 29, 2018 in Phoenix, Arizona. (Photo by Christian Petersen/Getty Images) /

More from Rox Pile

The thing you should take from this is that playing at a neutral site would not be detrimental to the Rockies, rather it’s more likely to be beneficial to them. The traditional stats aren’t going to be as friendly, but that’s not what you should be looking at in a scenario like this. A six-point increase in wRC+ should be expected, though the actual number may vary a couple points either way.

Are the comparisons I’ve provided here going to be exactly how each player would perform? Probably not exactly and you should still take them with a grain of salt, but they should give you a basic idea of how players like Arenado, Blackmon, and Story would actually perform away from Coors.

We’ve got plenty of examples of Rockies players getting better once they no longer call Coors their home and those players need to be viewed closer than simply looking at splits.

Next. The Top Five Center Fielders in Rockies history. dark

So while we wait for a decision on if we’ll even have a 2020 season, let’s ease up on the idea that playing at neutral sites would hurt the Rockies. We’ve got the data that proves otherwise. Let’s use it.

Next