WARPed on WAR: How each site’s WAR views the Colorado Rockies

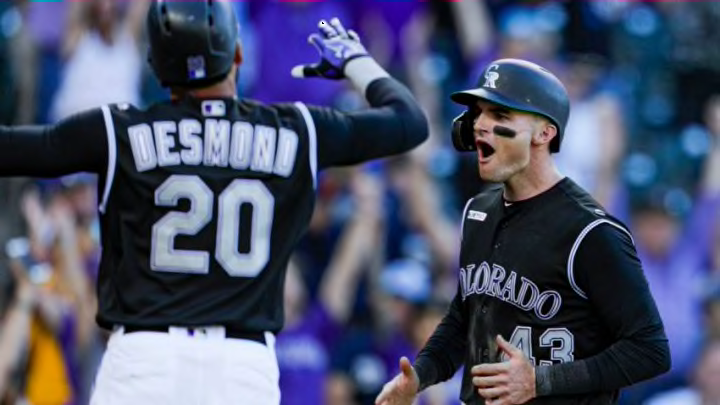
DENVER, CO - SEPTEMBER 29: Sam Hilliard #43 of the Colorado Rockies reacts to scoring in the 13th inning against the Milwaukee Brewers as Ian Desmond #20 of the Colorado Rockies congratulates him at Coors Field on September 29, 2019 in Denver, Colorado. Colorado won 4-3 in 13 innings. (Photo by Joe Mahoney/Getty Images)
7 of 8
Next
DENVER, COLORADO – AUGUST 02: Ryan McMahon #24 of the Colorado Rockies is congratulated by Daniel Murphy #9 after hitting a 2 RBI home run in the sixth inning against the San Francisco Giants at Coors Field on August 02, 2019 in Denver, Colorado. (Photo by Matthew Stockman/Getty Images)
DENVER, COLORADO – AUGUST 02: Ryan McMahon #24 of the Colorado Rockies is congratulated by Daniel Murphy #9 after hitting a 2 RBI home run in the sixth inning against the San Francisco Giants at Coors Field on August 02, 2019 in Denver, Colorado. (Photo by Matthew Stockman/Getty Images) /

In an age where advanced stats and analytics are furthering the game, it’s becoming increasingly important to understand more of the ins and outs of sabermetrics and how exactly to use each stat that’s been created. Casual baseball fans probably don’t know much about things like wRC+, wOBA, DRS, or UZR. It can be too complicated and different, so they’d rather just brush over them. The one stat they probably are somewhat familiar with, though? WAR.

WAR (Wins Above Replacement) has become the golden child of advanced stats, doing its best to estimate how valuable a player is above a league average replacement level player. It essentially takes how effectively a player is hitting, how effectively they’re fielding based off which position they play, then combines that with how often they’re doing it and boom, you’ve got WAR.

That’s the basics of it, but how exactly is it calculated and which stats are used? This is where things start to get tricky. There are three sites that champion their own formula of WAR: Fangraphs (fWAR), Baseball Reference (bWAR or rWAR) and Baseball Prospectus (WARP). Each site takes the basic ideas of assessing how effective each player hits and fields, but each site has different calculations for it. Much of it can be attributed to which defensive stat they’re using (DRS or UZR) or sometimes it can depend on things like park factors (hello, WARP).

Ideally, each type of WAR should give us a similar value for each player. That’s not always the case, though, and how you view a player (or a team) can vary greatly dependent on which site you’re using. For instance, if you’re looking at NL MVP candidate Christian Yelich then you could say his WAR is either 7.8, 7.1 or 6.5. Each is technically right, but that’s a pretty drastic difference going from 7.8 with Fangraphs to 6.5 with Baseball Prospectus.

Given that the changes within the formulas can affect how a player’s viewed to somewhat drastic levels, I wanted to take a look at how each site views the Rockies as a team to see if we would see something similar. I pulled the last 5 years of data for WAR from Fangraphs, Baseball Reference and Baseball Prospectus to see how each views not only the Rockies, but three other teams I had you all randomly select via Twitter (The Indians, Rays and Tigers).

LOS ANGELES, CA – SEPTEMBER 04: Nolan Arenado #28 of the Colorado Rockies reacts after hitting a base hit off of starting pitcher Hyun-Jin Ryu #99 of the Los Angeles Dodgers during the fifth inning at Dodger Stadium on September 4, 2019 in Los Angeles, California. (Photo by Kevork Djansezian/Getty Images)
LOS ANGELES, CA – SEPTEMBER 04: Nolan Arenado #28 of the Colorado Rockies reacts after hitting a base hit off of starting pitcher Hyun-Jin Ryu #99 of the Los Angeles Dodgers during the fifth inning at Dodger Stadium on September 4, 2019 in Los Angeles, California. (Photo by Kevork Djansezian/Getty Images) /

First, let’s examine how each site views the Rockies side by side. The tweet below shows a graph that compares Fangraphs, Baseball Reference and Baseball Prospectus side-by-side for the past five seasons along with the average of the three sites for each season as well.

The first thing you should be thinking when you look at this graph is, “What was Baseball Prospectus thinking in 2015 and 2016?” The drastic differences in those seasons between them and Fangraphs/BR is one of the main reasons you should be looking at more than just one site. We’ll get more into the specifics of each site later, but BP’s formula is going to be more favorable to Rockies hitters while it also punishes Rockies pitchers. Here’s how it breaks down when you compare Position Player WAR and Pitcher WAR from each site:

It should be fairly obvious now that Baseball Prospectus LOVES Rockies hitters and viewed them in higher regards than every other site in each of the seasons chosen besides 2016. As for the pitchers, Fangraphs and Baseball Reference seem to vary from each other in how they assess Rockies pitchers but neither are as harsh to them as Baseball Prospectus.

When you combine them with Position Players WAR, the Baseball Prospectus total generally averages out to a more honest number and finishes closer to Fangraphs and Baseball Reference, but how it gets there can definitely look pretty wonky.

CLEVELAND, OHIO – JULY 09: David Dahl #26 of the Colorado Rockies and Francisco Lindor #12 of the Cleveland Indians participates in the 2019 MLB All-Star Game at Progressive Field on July 09, 2019 in Cleveland, Ohio. (Photo by Kirk Irwin/Getty Images)
CLEVELAND, OHIO – JULY 09: David Dahl #26 of the Colorado Rockies and Francisco Lindor #12 of the Cleveland Indians participates in the 2019 MLB All-Star Game at Progressive Field on July 09, 2019 in Cleveland, Ohio. (Photo by Kirk Irwin/Getty Images) /

As for how the Rockies compare to the other teams that you in the Twitterverse helped select at random, here’s how their WAR totals vary by site:

The team with the least variation of these four teams is the Indians. Excluding their largest High/Low Gap of 7.5 (difference between Fangraphs and Baseball Prospectus in 2019), they only see gaps of about 2-3 “wins” each season while in 2015 each site viewed them nearly the exact same. The Rays’ gap is usually around 3-5 “wins” with the exception to 2018 and 2019 where Baseball Reference viewed them as about 7 and 10 wins higher respectively than Baseball Prospectus. If we ignore the monstrosities of 2015 and 2016 for the Rockies, their gaps stay between about 3-7 “wins”.

The biggest gaps happen with the Tigers. With the exception of 2018, the gaps range from 9.8 to 17.5 and all are the difference between Fangraphs (views them favorably) and Baseball Prospectus (views them unfavorably). The average gap between all four teams when you consider all data points is about 8.1 WAR (this drops to 6.7 if you exclude the 20.1 and 22.5 gaps for the 2015 and 2016 Rockies seasons). So WAR is assuredly more consistently funky for the Tigers than the other three teams due to Baseball Prospectus viewing them significantly lower than Fangraphs and Baseball Reference.

Now, I’m not trying to make any arguments for or against any site here as each has their own pros and cons, rather I hope what you’re getting from this is that it’s not enough to just look at one site’s WAR and assume it’s completely correct.

PHOENIX, ARIZONA – AUGUST 20: Kyle Freeland #21 of the Colorado Rockies pitches in the first inning against the Arizona Diamondbacks at Chase Field on August 20, 2019 in Phoenix, Arizona. (Photo by Norm Hall/Getty Images)
PHOENIX, ARIZONA – AUGUST 20: Kyle Freeland #21 of the Colorado Rockies pitches in the first inning against the Arizona Diamondbacks at Chase Field on August 20, 2019 in Phoenix, Arizona. (Photo by Norm Hall/Getty Images) /

Fangraphs

Fangraphs is traditionally tougher on the Rockies compared to its counterparts. It often views players through the lens of “what should have happened” instead of “what actually happened” and measures players differently when it comes to defense. There’s also a big difference between how they calculate Pitching WAR compared to Baseball Reference, which we’ll get into.

If you want to read the formula for how Fangraphs calculates WAR, click here. It’s pretty extensive, though, so examine at your own will.

The biggest difference in how it calculates a position player’s WAR is that it uses UZR (Ultimate Zone Rating) to measure a player’s defensive skills compared to DRS (Defensive Runs Saved). You’ll notice this when it comes to players like Nolan Arenado. His career fWAR sits at 31.3 whereas if you look at Baseball Reference he’s currently at 38.7. Fangraphs also uses wRC+ to measure a hitter’s effectiveness (which factors into WAR) but it’s generally pretty close to how Baseball Reference views players too with OPS+.

The biggest difference you’ll notice for pitchers is how Fangraphs uses a stat called FIP (Fielder Independent Pitching) compared to how Baseball Reference focused more simply on Runs Allowed (read their Pitcher’s WAR calculations here). FIP measures how well a pitcher performs based off how well he can control everything that’s within his power (Walks, Strikeouts and Home Runs).

Essentially anything that’s hit to a fielder has an element of luck attached to it, so Fangraphs doesn’t consider that when calculating FIP. This also ignores sequence, so any outcome of a situation with 2 walks, 3 strikeouts and a home run would end up with the same FIP even though the total runs scored could be different (minimum of 1 run, max of 3).

Kyle Freeland is a perfect example of how Fangraphs’ WAR can undervalue pitchers who pitch to contact. In 2018 he finished with an fWAR of 4.1. That put him in a tie for 7th place in the NL with fellow Rockies starter German Marquez even though Freeland was nearly 20 points better in ERA- (Fangraphs’ Park Adjusted ERA). Over at Baseball Reference Freeland ranked 4th in WAR for NL Pitchers with a WAR of 8.4.

Does that mean that Fangraphs’ calculation for Pitching WAR is inaccurate? Not necessarily. Pitching WAR in itself can be a jumbled mess regardless of the site you’re looking at. Fangraphs just values the Three True Outcomes (HRs, Ks, BBs) more than the other sites as balls in play have elements of luck to them.

Fangraphs is still pretty trustworthy, though. It should be viewed as a good starting point for Rockies players and a way to temper your expectations on WAR. If a Rockie is Top 5 in WAR according to Fangraphs then he’s assuredly a Top 5 player in the league. But Fangraphs is generally the low bar for Rockies players.

DENVER, COLORADO – AUGUST 04: Starting pitcher Kyle Freeland #21 of the Colorado Rockies throws in the fifth inning against the San Francisco Giants at Coors Field on August 04, 2019 in Denver, Colorado. (Photo by Matthew Stockman/Getty Images)
DENVER, COLORADO – AUGUST 04: Starting pitcher Kyle Freeland #21 of the Colorado Rockies throws in the fifth inning against the San Francisco Giants at Coors Field on August 04, 2019 in Denver, Colorado. (Photo by Matthew Stockman/Getty Images) /

Baseball Reference

After a lot of the breakdown of the differences in Fangraphs vs Baseball Reference, it should be pretty clear that Baseball Reference is generally going to view the Rockies a bit more favorably. It’s generally going rate players more positively than Fangraphs, though, as we can see with the comparisons with the Rays, Indians and Tigers (though the Tigers are a bit of an anomaly here).

For the Rockies it appears that the biggest reason that Baseball Reference can view players more favorably is how it calculates Pitching WAR. In all but 2016, Baseball Reference was the highest on Rockies pitchers. This is almost assuredly the difference between Fangraphs using FIP and Baseball Reference looking more at Runs Allowed. Baseball Prospectus is consistently harsh on Rockies pitchers compared to the other two, but we’ll evaluate that later.

One of the more drastic notices that we already pointed out was Kyle Freeland’s 2018 season. His fWAR/bWAR/WARP splits were 4.1/8.4/3.3. So why did Baseball Reference view him so much more favorably than Fangraphs and Baseball Prospectus? It comes down to the fact that Freeland’s season was predicated off of him pitching more to contact rather than getting strikeouts.

Fangraphs’ discrepancy can be related more to FIP while Baseball Prospectus is more complicated. It uses a stat called DRA (Deserved Runs Allowed) that’s very similar to FIP but encapsulates more factors than just the Three True Outcomes. Between that and its park factors being different, that’s why Baseball Prospectus viewed Kyle Freeland so much lower than Baseball Prospectus.

DENVER, CO – JULY 15: Ryan McMahon #24 of the Colorado Rockies is congratulated in the dugout after hitting a seventh inning solo homer against the San Francisco Giants during game one of a doubleheader at Coors Field on July 15, 2019 in Denver, Colorado. (Photo by Dustin Bradford/Getty Images)
DENVER, CO – JULY 15: Ryan McMahon #24 of the Colorado Rockies is congratulated in the dugout after hitting a seventh inning solo homer against the San Francisco Giants during game one of a doubleheader at Coors Field on July 15, 2019 in Denver, Colorado. (Photo by Dustin Bradford/Getty Images) /

For position players, the main difference is how it measures defense. The offensive measure that Baseball Reference uses (OPS+) is generally going to be pretty close to Fangraphs when they use wRC+ and their park factors are similar so we don’t need to worry as much about how they rate hitters. Instead, it’s the defensive difference between using UZR (Fangraphs) and DRS (Baseball Reference) that separates them (again, Baseball Prospectus uses a different stat).

Let’s use Ryan McMahon as an example. He has an fWAR in 2019 of 0.6 and a bWAR of 1.5. When it comes to UZR, Fangraphs ranks him as the 22nd best out of 23 2B in the NL for those who fielded there for at least 300 innings. Among the same fielders, he ranks 7th in terms of DRS.

Now Fangraphs does try to encapsulate both when determining its defensive factor that gets pulled into its WAR formula, but by that measure it still relies heavily on UZR and puts McMahon as the 21st best 2B out of 23. The focus that Baseball Reference puts on DRS certainly factors into why its WAR is nearly 1.0 higher than what Fangraphs calculates.

When using Baseball Reference, always try to keep in mind that it’s probably higher on the Rockies than what you’re going to see on Fangraphs. And if you’re looking at pitchers it’s most likely going to be a little higher than what you see from Baseball Prospectus as well.

It’s generally more friendly to the Rockies and that’s great, but always assume that bWAR can be the potential high point for a Rockies player, especially a pitcher.

DENVER, COLORADO – JULY 29: Nolan Arenado #28 of the Colorado Rockies hits a 2 RBI single in the fifth inning against the Los Angeles Dodgers at Coors Field on July 29, 2019 in Denver, Colorado. (Photo by Matthew Stockman/Getty Images)
DENVER, COLORADO – JULY 29: Nolan Arenado #28 of the Colorado Rockies hits a 2 RBI single in the fifth inning against the Los Angeles Dodgers at Coors Field on July 29, 2019 in Denver, Colorado. (Photo by Matthew Stockman/Getty Images) /

Baseball Prospectus

Baseball Prospectus does things quite differently from Fangraphs and Baseball Reference. For starters, their Park Factors are going to be different from the other two sites. For most other teams it’s not going to always be as drastic, but here’s where it really affects the Rockies:

Fangraphs and Baseball Reference have a Park Factor for Coors Field at 115 and 118 while Baseball Prospectus has it narrowed down to 113. Essentially, the lower the park factor the better for Rockies hitters and Baseball Prospectus certainly favors Rockies hitters.

They also use a stat called DRC+ (Deserved Runs Created) to further help evaluate hitters that also takes into effect things like the level of talent that a hitter is facing and their expected contribution instead of simply averaging out what happened.

Think of it as a stat like wRC+ and OPS+, but BP has worked to try to improve it. You see general differences with Rockies hitters such as Nolan who had a wRC+ in 2019 of 128 while his DRC+ sat at 136. This helps bump up his value through Baseball Prospectus as they view him as a better hitter than the other two sites.

The other main difference with WARP is how it measures players defensively. Yet again, they use a different defensive stat call FRAA (Fielding Runs Above Average) that ignores stats like DRS and UZR and instead simply focuses on each individual play and all the contributing factors to it (a pitcher’s GB%, batter handedness, park factors, etc) and sees how many times more a player made that play compared to league average.
DENVER, CO – JULY 15: Nolan Arenado #28 of the Colorado Rockies fields a ground ball at third base in the first inning during game two of a doubleheader against the San Francisco Giants at Coors Field on July 15, 2019 in Denver, Colorado. (Photo by Dustin Bradford/Getty Images)
DENVER, CO – JULY 15: Nolan Arenado #28 of the Colorado Rockies fields a ground ball at third base in the first inning during game two of a doubleheader against the San Francisco Giants at Coors Field on July 15, 2019 in Denver, Colorado. (Photo by Dustin Bradford/Getty Images) /

More from Rox Pile

In terms of fielding, it’s him vs Matt Chapman for the top spot. UZR and DRS (and Fangraphs’ Defensive factor) ranks Chapman as having being the more convincing fielder over Arenado. Whereas FRAA gives Nolan the edge as the better fielder by a slim margin.

With all factors considered, Nolan’s WARP in 2019 finished at 7.1 (5.9 fWAR, 5.7 bWAR). We shouldn’t be surprised by this considering we already know that Baseball Prospectus likes Rockies hitters much better than the other two, but it’s also going to generally be lower on pitchers.

For instance, Antonio Senzatela did not have his best season and we all know that. His WARP sits down all the way at -1.9. Comparatively, his fWAR is 0.7 and his bWAR is -0.1. When compared to Fangraphs that’s nearly a 3 game difference and that’s pretty drastic.

A large contributor will be DRA- (Deserved Runs Allowed). Baseball Prospectus had Senzatela’s DRC- at 146.5 (essentially he’s 46.5% worse than your average pitcher). Whereas Fangraphs has Senzatela’s ERA- (park factored ERA) at 133. The double-digit difference is a huge reason for the gap and because of it Baseball Prospectus is significantly lower on Senzatela than Fangraphs and Baseball Reference.

That’s not always going to be the case, though, as a few other pitchers on the Rockies happen to have similar fWAR/bWAR/WARP splits. When looking at a Rockies pitcher’s WARP, though, you should always keep in mind that it’s likely undervaluing him compared to Fangraphs and Baseball Reference. And keep that in mind for hitters as well as it can overrate them just as much comparatively.

Final Thoughts

As I stated before, none of this is an argument either for or against each site as each have their own reasons for viewing players the way they do and each is right in their own regards. Just try not to use one site as your sole source of truth as you may be missing some value in a player that the other sites capture (or you could even be overvaluing a player by only relying on one source).

Next. What the potential 2021 MiLB changes could mean for the Colorado Rockies minor league affiliates. dark

Hopefully there will be a single formula that’s agreed upon in the future to create an official WAR stat that the MLB recognizes to help introduce it further to casual fans. Until then, always try to view it from as many angles as possible to capture everything you need.

Next