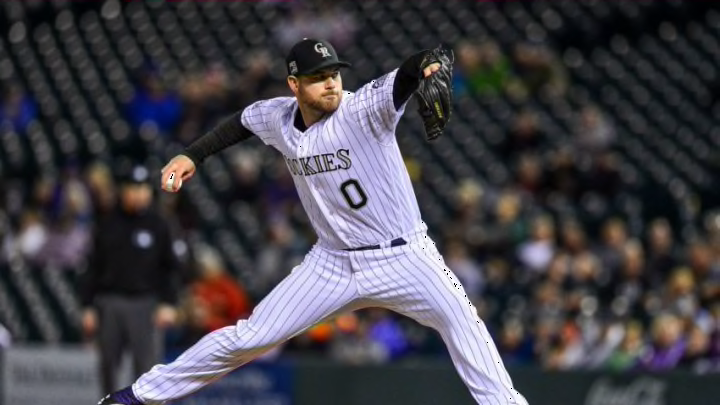
In 2003, the Rockies had three All Stars representing them at, what was at the time called, Comiskey Park (later known as U.S. Cellular Field and now known as Guaranteed Rate Field), the home of the Chicago White Sox. Their reps were Todd Helton (shocker), pitcher Shawn Chacon, and outfielder Preston Wilson.
Even though the Rockies were not good, they surprisingly still could have had a few more All-Stars. In fact, it could be argued that the entire Rockies outfield that year should have been All-Stars. One of them was Larry Walker. He did not have as strong of a year as he did in 2002 but still pretty good.
| Split | G | PA | AB | R | H | 2B | 3B | HR | RBI | BB | SO | BA | OBP | SLG | OPS | BAbip | sOPS+ |
|---|---|---|---|---|---|---|---|---|---|---|---|---|---|---|---|---|---|
| 1st Half | 89 | 360 | 292 | 61 | 86 | 17 | 7 | 9 | 54 | 62 | 52 | .295 | .428 | .493 | .921 | .333 | 145 |
Another outfield snub was Jay Payton, who put up the best numbers he would have in his career.
| Split | G | PA | AB | R | H | 2B | HR | RBI | BB | SO | BA | OBP | SLG | OPS | BAbip | tOPS+ | sOPS+ |
|---|---|---|---|---|---|---|---|---|---|---|---|---|---|---|---|---|---|
| 1st Half | 92 | 391 | 354 | 62 | 105 | 15 | 13 | 48 | 28 | 45 | .297 | .352 | .472 | .824 | .310 | 92 | 117 |
Out of the bullpen, Brian Fuentes had numbers that were pretty good too.
| Split | W | L | W-L% | ERA | G | GF | SV | IP | H | R | ER | HR | BB | SO | WHIP | SO9 | SO/W |
|---|---|---|---|---|---|---|---|---|---|---|---|---|---|---|---|---|---|
| 1st Half | 2 | 0 | 1.000 | 3.22 | 44 | 9 | 2 | 44.2 | 38 | 17 | 16 | 4 | 21 | 53 | 1.321 | 10.7 | 2.52 |
| Split | G | PA | AB | R | H | 2B | HR | BB | SO | SO/W | BA | OBP | SLG | OPS | BAbip | tOPS+ | sOPS+ |
|---|---|---|---|---|---|---|---|---|---|---|---|---|---|---|---|---|---|
| 1st Half | 44 | 192 | 164 | 17 | 38 | 7 | 4 | 21 | 53 | 2.52 | .232 | .333 | .372 | .705 | .312 | 107 | 88 |
