Colorado Rockies: 2017 performance based on fastball velocity

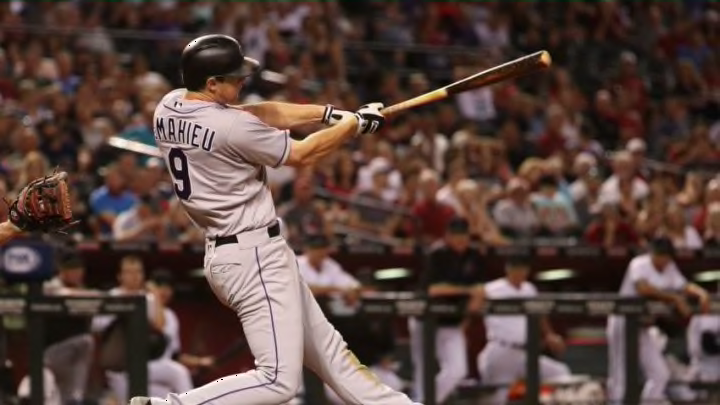
PHOENIX, AZ - SEPTEMBER 12: DJ LeMahieu #9 of the Colorado Rockies hits a single against the Arizona Diamondbacks during the seventh inning of the MLB game at Chase Field on September 12, 2017 in Phoenix, Arizona. (Photo by Christian Petersen/Getty Images)
2 of 3
Next
DENVER, CO – OCTOBER 01: Carlos Estevez #54 of the Colorado Rockies pitches during a regular season MLB game between the Colorado Rockies and the visiting Los Angeles Dodgers at Coors Field on October 1, 2017 in Denver, Colorado. (Photo by Russell Lansford/Getty Images)
DENVER, CO – OCTOBER 01: Carlos Estevez #54 of the Colorado Rockies pitches during a regular season MLB game between the Colorado Rockies and the visiting Los Angeles Dodgers at Coors Field on October 1, 2017 in Denver, Colorado. (Photo by Russell Lansford/Getty Images) /

Last week, I looked at a season-long split that analyzed how the Colorado Rockies played in different uniforms in 2017. I want to continue the theme of unusual splits, but this time let’s take a look at a factor that has more obvious relevance: opposing pitcher fastball velocity.

As has been well documented over recent years, the average velocity of pitchers across baseball is rising. It used to be just a chosen few who could hit triple digits with the fastball while still maintaining enough control to stick around in the big leagues. Now, however, it seems like every Major League team has someone who can at least touch 100 mph on the speed gun (think Rockies’ Carlos Estevez), while some teams have guys who hang out at or above 100 mph (looking at you, Aroldis Chapman).

On the other hand, we have the precision pitchers. Either not blessed with the flamethrower arm or wise enough to realize they can’t control such speed, there is still a place for the finesse folks. These guys are able to master three, four, sometimes five pitches that they can manipulate around the edges of the plate just enough to keep opposing lineups off-balance.

More from Rox Pile

Throughout last season, I was curious if there was a preference in the Rockies clubhouse towards one style or the other. Do they like the fastball-loving tendencies of the flamethrowers or did we lick our chops at a little less velocity?

To figure this out, I did some research and found that 315 pitchers made at least one Major League start in 2017. Using FanGraphs, I sorted all of them by average fastball velocity and created three groups, each with about 105 players (1/3 of the total, plus ties). Let’s take a look at what that looks like.

PHOENIX, AZ – SEPTEMBER 12: DJ LeMahieu #9 of the Colorado Rockies hits a single against the Arizona Diamondbacks during the seventh inning of the MLB game at Chase Field on September 12, 2017 in Phoenix, Arizona. (Photo by Christian Petersen/Getty Images)
PHOENIX, AZ – SEPTEMBER 12: DJ LeMahieu #9 of the Colorado Rockies hits a single against the Arizona Diamondbacks during the seventh inning of the MLB game at Chase Field on September 12, 2017 in Phoenix, Arizona. (Photo by Christian Petersen/Getty Images) /

The Tiers

  • Tier 1 belongs to the flamethrowers. These guys have fastballs that average 93 mph or faster. Some examples in this group who the Rockies see often include divisional opponents Clayton Kershaw, Jeff Samardzija and Taijuan Walker.
  • Tier 2 is our average group, with fastballs that average 91.1 mph to 92.9 mph. Common Rockies opponents in this range include Johnny CuetoAlex Wood, and Patrick Corbin.
  • Tier 3 is home to the hurlers who tend to rely a bit more on location and changing speeds, rather than overpowering the man in the batter’s box. Their fastballs average velocities of 91 mph and below. That’s not to say these guys are easy to hit, as this group includes the likes of Zack Greinke, Hyun-jin Ryu, and Jered Weaver.

With that established, I went through the Rockies entire 2017 schedule and documented the pitcher they faced in each game, which velocity tier that pitcher fell in, and the box score line the Rockies racked up against him. With starting pitchers leaving the game at different points in the game each day, I went ahead and averaged the totals per nine innings to standardize the data. Now for the results!

The Results

Tier 1 (93.0+ MPH)

  • 73 Games Played (.575 Win%)
  • 5.35 Average IP
  • 9.87 Hits/9
  • 3.18 Walks/9
  • 8.74 Strikeouts/9
  • 1.36 Home Runs/9
  • 5.42 ERA

Tier 2 (91.1-92.9 MPH)

  • 57 Games Played (.421 Win%)
  • 5.36 Average IP
  • 9.95 Hits/9
  • 3.47 Walks/9
  • 8.45 Strikeouts/9
  • 1.12 Home Runs/9
  • 4.98 ERA

Tier 3 (91.0 MPH and Below)

  • 32 Games Played (.656 Win%)
  • 5.42 Average IP
  • 10.38 Hits/9
  • 3.01 Walks/9
  • 7.17 Strikeouts/9
  • 1.77 Home Runs/9
  • 5.56 ERA

*Boldface type indicates which tier the Rockies performed best against in each respective box score line item

There’s a lot to unpack here. The first point I’ll direct your attention to is just how many games the Rockies played against Tier 1, hard-throwing pitchers in 2017. Recall that I split the total number of starting pitchers into equal thirds, so probability-wise there’s reason to anticipate playing roughly equal numbers of games against each tier. Reality, however, had the Rockies facing high velocity pitchers more than twice as much as they faced the third tier precision guys.

As I set out to do this research, I had some guesses as to how the data would play out. Some of these guesses panned out, while others were off, sometimes way off. For example, I anticipated that strikeouts would be proportional with fastball velocity, and that turned out to be true. The faster the pitchers threw, the more times the Rockies made that U-turn from the batter’s box back to the dugout. Similarly, I correctly predicted that hits would be inversely  proportional to velocity (hits go up as velocity goes down).
DENVER, CO – AUGUST 18: Nolan Arenado #28 of the Colorado Rockies follows the flight of a third inning triple against the Milwaukee Brewers at Coors Field on August 18, 2017 in Denver, Colorado. (Photo by Dustin Bradford/Getty Images)
DENVER, CO – AUGUST 18: Nolan Arenado #28 of the Colorado Rockies follows the flight of a third inning triple against the Milwaukee Brewers at Coors Field on August 18, 2017 in Denver, Colorado. (Photo by Dustin Bradford/Getty Images) /

One area that surprised me, however, was that the Rockies hit BY FAR the most home runs per nine innings against the precision pitchers. I know, the difference between 1.12 HR/9 and 1.77 HR/9 seems minuscule, but I assure you that over this large of a sample size and this small of numbers, it is pretty significant.

It surprises me because typically power hitters like to hunt that fastball, and we all know that the more power provided in the pitch, the faster a well-struck ball is going to come sizzling off the barrel. In this case, however, it seems the Rocks’ power bats struck down that notion and licked their chops a little more against the slower throwers.

Colorado Rockies
Colorado Rockies /

Colorado Rockies

Another of the more puzzling pieces for me is the middle group: our average velocity hurlers. As you can see, opposing pitchers’ ERA against the Rockies in Tiers 1 and 3 are very similar. The folks in the middle, however, managed an ERA roughly a half run lower. Along with that, the Rockies averaged the fewest home runs against this group. I haven’t brought up win percentage against the three tiers yet because factors play into wins and losses that I haven’t accounted for here, such as opposing bullpens as well as our own starting pitcher’s performance that day. That being said, the Rockies really struggled against Tier 2 in the win/loss column as well, going 24-33 in such games, by far the worst of the 3 tiers.

If I had to come up with a likely reason that the Rockies performance dipped against pitchers with average fastball velocity, I would say it lies in the idea that when you face a high velocity pitcher, you know what you are going to get. You’re going to see a little more fastball. Similarly, with guys who don’t light up the radar gun anymore, you know to expect a little more off-speed action. With this confidence, and a plan in place, perhaps the Rockies perform a little better.

With the guys in the middle, however, it’s possible that the Rockies find themselves in that dreaded “in-between” area: not quite geared up for the fastball, but out in front of the off-speed pitches. They can’t sit on the breaking ball and still catch the fastball, so they must respect the fastball and leave themselves vulnerable to the off-speed. This cat-and-mouse game may insert just enough doubt in the Rockies’ hitters minds that our numbers dip a bit.

Overall, we can see that the Rockies are most successful against Tier 3. The Rockies hit more, strike out less, hit more balls over the wall, and win more when they are not worrying quite so much about catching up to a bullet. That isn’t to say the numbers against Tiers 1 and 2 are bad (they’re not), but the cat and mouse game of average arms may be just one more thing to work on for our hitters going forward.

Next: Examining the worst-case injury scenarios for the Rockies

Being a member of the pitching-laden National League West, the Rockies are sure to always have a healthy dose of both rocket arms as well as guys who beat you with surgeon-like precision. Let’s just hope the Rockies bring their A-Game when Colorado runs into those guys who do a little bit of both. Baseball games have returned!

Next