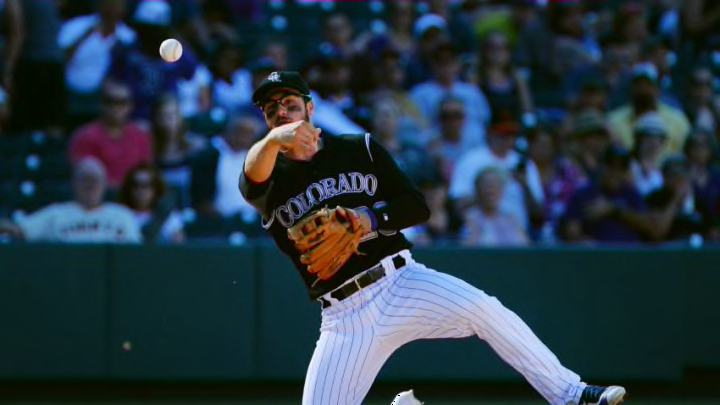
Widely regarded as the best player in Major League Baseball, Mike Trout of the Los Angeles Angels of Anaheim is the only person who could rival Arenado in the crown of best player in baseball. In the past five seasons, Trout has won two American League Most Valuable Player Awards and in the other three years, he came in second (to Miguel Cabrera of the Detroit Tigers in 2012 and 2013 and Josh Donaldson of the Toronto Blue Jays in 2015, respectively). However, are Arenado and Trout even comparable to each other in the past three seasons.
In 2015, Trout played in 159 games and offensively, and he was 27th in the AL in at-bats (575), 3rd in runs (104), tied for 13th in hits (172), tied for 28th in doubles (32), tied for 3rd in home runs (41), 14th in RBIs (90), third in walks (92), ninth in batting average (.299), second in on-base percentage (.402), and led the league in slugging percentage (.590).
In 2015, Arenado played in 157 games and offensively, he was in the top ten National League qualifiers in many statistics. He had 616 at bats (second), 97 runs (seventh), 177 hits (fifth), 43 doubles (tied for second), 42 home runs (tied for the NL lead), 130 RBIs (led the league with 20 RBIs more than the next qualifer, Arizona’s Paul Goldschmidt), and a .575 slugging percentage (2nd).

Defensively, Trout had five Defensive Runs Saved and fourth of all American League outfielders with a 2.79 range factor. In Defensive Wins Above Replacement, Trout did not rank in the top 10 in the American League.
Defensively in 2015, Arenado led qualifying third basemen with a 3.12 range factor (which is (Putouts+Assists)/Innings Played). He also had 18 Defensive Runs Saved (which lead the league at third basemen) and led NL third basemen with a 2.2 Defensive Wins Above Replacement (which was sixth, overall, in the major leagues). He also led the third basemen with 42 double plays turned.
Overall, Arenado had a WAR of 5.8 and he was an All-Star, ranked eighth in the MVP voting, won the Gold Glove for NL third basemen, the Silver Slugger Award for his position, and he won the 2015 Wilson Defensive Player of the Year.
Trout was an All-Star, Silver Slugger Award winner for outfielders (three are chosen for the three outfield spots), and he came in second in the AL MVP voting. He had a WAR of 9.4.
Since Trout and Arenado are close offensively with some numbers leaning to Trout (like batting average and on-base percentage) and some leaning to Arenado (like home runs, RBIs, and hits), they are about even offensively by the numbers. However, since Arenado plays half of his games in Coors Field, which is much more of a hitter’s park than Angel Stadium, you have to look at their OPS+. OPS+ (which adjusts for ballparks played in) is very different between the two. Trout’s was 176 (which 100 is league average). Arenado’s was 124. Therefore, the reasoning why their WAR’s are so far a part, offensive is much easier to come by when you play half of a season at Coors Field. Arenado, though, is obviously, the better defender.
Now, let’s compare their 2016 seasons by their offensive numbers.
